
前提条件
- C#
- System.Windows.Forms.DataVisualization.Charting.Chartを使用
概要
C#にて箱ひげ図を表示する方法を記載します。
箱ひげ図とは
箱ひげ図の概要
箱ひげ図は1970年代にアメリカの数学者のジョン・ワイルダー・テューキーが提唱した図で、主に以下を表現します。
- データのばらつき具合
- 最大値・最小値
- 中央値
- 平均値
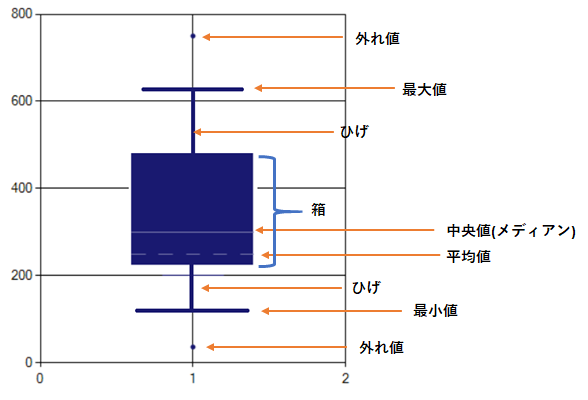
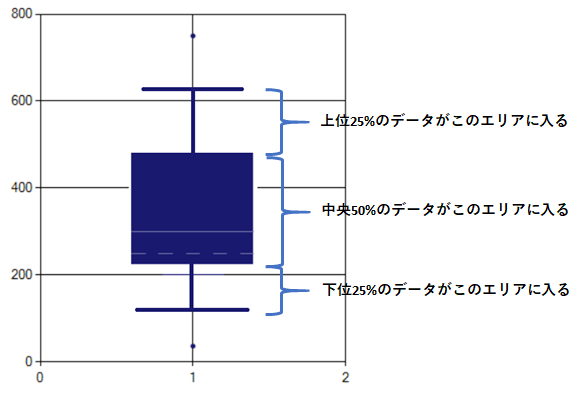
箱ひげ図のイメージ
箱ひげ図のイメージと表す意味を記載します。
C#で箱ひげ図を書いてみる
Point
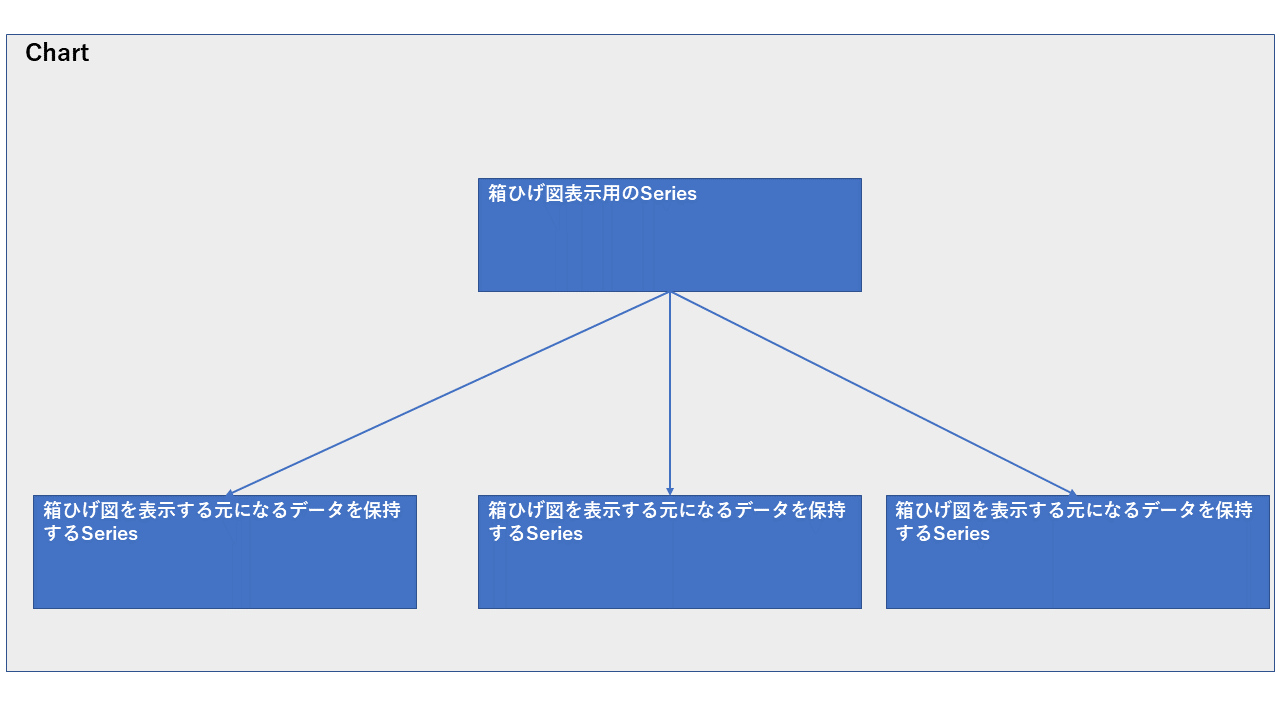
箱ひげ図をChartで表示するには、大きく以下の2つのSeriesが必要になります。
- 箱ひげ図を表示する元になるデータを保持するSeries
- 箱ひげ図を表示するためのSeries
また、箱ひげ図を表示する際は、箱ひげ図のSeriesに表示する対象データを保持するSeriesを紐づける必要があります。
ソースコード
private void button1_Click(object sender, EventArgs e)
{
    //Series生成
    Series[] seriesList = this.GetSampleSeriesList();

    //ChartにSeriesを追加
    foreach (Series series in seriesList)
    {
        //元データのSeriesは表示しないように
        series.Enabled = false;
        chart1.Series.Add(series);
    }

    //BoxPlotのSeriesを生成
    Series boxPlotSeries = new Series("BoxPlot");
    boxPlotSeries.ChartType = SeriesChartType.BoxPlot;

    //箱ひげ図のSeriesとデータを保持するSeriesの紐づけ
    //(複数のSeriesを指定する場合はSeries名を;区切りで指定する。)
    boxPlotSeries["BoxPlotSeries"] = string.Join(";",
        seriesList.Select(s => { return s.Name; }).ToArray());

    //ChartにBoxPlotSeriesを追加
    chart1.Series.Add(boxPlotSeries);
}

private Series[] GetSampleSeriesList()
{
    //Seriesの作成に使用するサンプルデータを定義
    double[][] dataList = new double[][]
        {
            new double[] { 1, 2, 3, 4, 5, 6, 7, 8, 9, 10 },
            new double[] { 11, 12 , 13, 14, 15, 16, 17, 18, 19, 20 },
            new double[] { 21, 22 , 23, 24, 25, 26, 27, 28, 29, 30 },
        };

    //Seriesを生成
    List<Series> seriesList = new List<Series>();
    for (int i = 0; i < dataList.Length; ++i)
    {
        string seriesName = string.Format("Class{0}", (i + 1));
        Series series = new Series(seriesName);

        for (int j = 0; j < dataList[i].Length; ++j)
        {
            series.Points.Add(dataList[i][j]);
        }

        seriesList.Add(series);
    }

    return seriesList.ToArray();
}
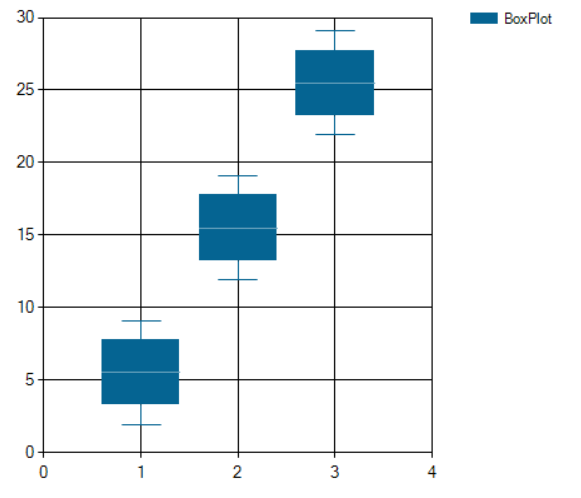
実行結果
その他
以下のカスタムプロパティを指定することで、様々な設定が可能です。(主要なものだけ載せてます)
| カスタムプロパティ名 | 説明 | 使用例 |
|---|---|---|
| BoxPlotWhiskerPercentile | 外れ値の割合指定。 | boxPlotSeries[“BoxPlotWhiskerPercentile”] = “0”; |
| BoxPlotShowAverage | 平均値表示有無。 | boxPlotSeries[“BoxPlotShowAverage”] = “true”; |
| BoxPlotShowMedian | 中間値表示有無。 | boxPlotSeries[“BoxPlotShowMedian”] = “true”; |
| BoxPlotShowUnusualValues | 外れ値の表示有無。 | boxPlotSeries[“BoxPlotShowUnusualValues”] = “true”; |


コメント